Taking a sample
There are five different ways to take a sample:- loading a sample from a file,
- taking it from one of the predefined processes,
- taking it from a polynomial,
- drawing it by hand and
- merging two or more samples into a new sample.
Loading a sample from a file. If the file method is selected, the user has to select a file through the standard file browser. The file has to be in ASCII format. Once the file is selected, a new window pops up and shows the contents of the file. Now there are two ways to select the data: by regular expression or by column. The options can be selected by radio buttons. You should have some experience with regular expressions when using this option. An introduction and a list of special characters are here available.
If the regex option is chosen, a regular expression has to be entered for both the x and the y values. All lines of the file are parsed. For each line that is matched by both expressions a point is added to the sample. In order to work correctly, the expression usually has to match more than only the intended value. The number of the opening parenthesis that encloses the portion of the expression that actually contains the value must be entered in a separate input field. You can check whether the expressions capture the correct values by pressing the apply button. It will show the captured portions of the text in different colors. If you are satisfied, press the OK button.
Example: we want to study the number of sold products as a function of the consumer price. The lines of our input file have the following format:
A regular expression that will match the x-value is
and the first opening parenthesis captures the value. The y-value will be matched by the expression
where opening parenthesis number three captures the value.
The other option is to use columns. Every line of the text is divided into a number of columns by a regular expression. This expression is usually very simple, e.g. white space or a colon. The column numbers that specify the x and the y-value have to be entered. For each line of the file that has real values in both columns a point is added to the sample.
Taking a sample from a process. In order to use this option, a process must already have been specified. It can then be selected as an attribute of the sample. A distribution over the measurement noise should also be selected. There are four distributions available: Gaussian, uniform, exponential and Cauchy. The Cauchy distribution is important to simulate far outliers. Like the other distributions the Cauchy distribution is symmetric around the mean and non-increasing. But it has no calculable variance. Its density function is
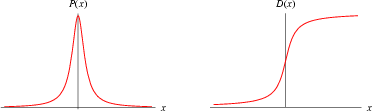
where μ is the mean and s the distance between the mean and the point that has half the probability of the mean.
The points will be taken at random over the support, which is the range along the x-axis for which the process is defined. The grains attribute specifies the distribution over the support. It can either be uniform or a number between one and nine. If there is one grain, the distribution will be Gaussian around the center of the support. If there are two grains, there will be a center at one third and another at two thirds of the support range. The distribution over the support will be the joint distribution of two Gaussian distributions. Three grains will have a center at 1/4, 2/4 and 3/4 of the range etc. With nine grains the joint distribution of nine Gaussian distributions is almost uniform.
After the desired size of the sample has been entered at the size attribute, a click on the make action will take the sample from the process. To guarantee that all experiments can be repeated, values of the seed attribute other than zero will always produce the same sample under the same conditions.
Drawing a sample. Drawing a sample is straightforward. When this option is chosen and the sample is in the editor, moving the mouse over the main plot and pressing the right mouse button will produce points on the plot. Points can also be drawn after a sample has already been loaded from a file or been taken from one of the predefined processes. In this way particular problems can be pinpointed, e.g. far outliers. You also can simulate noise along the entire range of the y-axis for a limited range of x. In the example 3,000 points were taken from a pendulum in the usual way. After that, 1,000 points were added by hand to simulate corruption of the measurements at x=[4.6, 5.2] and x=[8.4, 9.3]
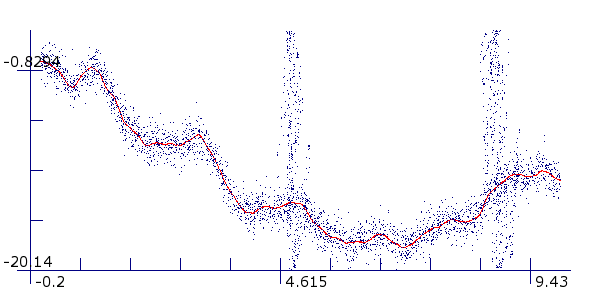
Pendulum with corrupted measurement
Taking a sample from a polynomial. Taking a sample from a polynomial is very similar to taking a sample from a process. The only difference is that a polynomial must be specified in a different way. Entering the parameters of a polynomial by hand usually does not lead to the desired results. Instead, the following procedure should be followed: first, draw a line by hand on the plot that has the outline of the desired polynomial. Then, fit a polynomial of the desired degree on this hand drawn line. How to do this will be explained in the section on polynomials. This polynomial should then be used to take other samples from it. The original hand drawn line can be deleted.
If you still insist on entering the parameters by hand, this can be done as well. Save a project that contains a polynomial of the desired degree. All projects are saved in XML format and can easily be edited by hand. Replace the parameters of the saved polynomial by your own values and reload the experiment.
Merging samples. When the merge method is selected, up to four different samples can be specified that will be merged into a new sample. As usual, the take action will create the new sample from the specified source samples. The source samples are not changed or deleted.
Splitting samples. A sample can also be split in two. This is useful when a sample has been taken from a file or drawn by hand and we need to split it into a training and a test sample. Splitting is not a method of a sample. You need to select the split operator from the main menu.
Once created, the split operator is loaded into the editor. The sample that will be split has to be selected and the number or percentage of points that will go into subsample A must be entered. Clicking on the split action will split the selected sample at random. The specified number of points will go to subsample A and the rest will go to subsample B. The new samples are visible on the main plot and are available from the list box. The selected sample is not changed or deleted.